Key Takeaways Puntos Clave Pontos Principais
- Define a data contract upfront to prevent endless downstream rework
- Normalize early: addresses, enums, numbers, and currency formats
- Use identity-based deduplication, not hope-based merging
- Implement change detection with hashes instead of full refreshes
- Monitor both pipeline health and data quality-alerts are essential
- Define un contrato de datos desde el inicio para evitar retrabajo
- Normaliza temprano: direcciones, enums, numeros y formatos de moneda
- Usa deduplicacion basada en identidad, no en esperanza
- Implementa deteccion de cambios con hashes en lugar de refresh completo
- Monitorea salud del pipeline y calidad de datos-las alertas son esenciales
- Defina um contrato de dados desde o inicio para evitar retrabalho
- Normalize cedo: enderecos, enums, numeros e formatos de moeda
- Use deduplicacao baseada em identidade, nao em esperanca
- Implemente deteccao de mudancas com hashes em vez de refresh completo
- Monitore saude do pipeline e qualidade de dados-alertas sao essenciais
Real estate teams love data until it becomes unreliable. If your "pipeline" is a single scraper running on someone's laptop, you're one HTML change away from broken dashboards, stale listings, and missed opportunities. The moment your pricing data is off by 24 hours, or duplicate listings flood your search results, trust evaporates. Agents stop checking your platform. Buyers miss opportunities. Your competitive advantage disappears.
The real estate data landscape is uniquely challenging. MLS feeds update irregularly, public listing sites change their markup weekly, and different sources use completely incompatible schemas for the same property. A condo might be "Unit 5B" in one feed, "5-B" in another, and "Apt 5B" in a third. Prices might include HOA fees in one source but exclude them in another. Some feeds provide square footage as total area, others as livable space only.
Building a reliable real estate data pipeline isn't about writing clever scraping code-it's about establishing systems that handle variance, detect breakage, and maintain data quality under constant change. The difference between a fragile script and a production pipeline is the same as the difference between a prototype and a product: one works until it doesn't, the other is designed to fail gracefully and recover automatically.
A production data pipeline is not just extraction-it's contracts, normalization, deduplication, change detection, and monitoring. Each of these components is non-negotiable for reliability at scale.
How to read the stories below: the company anecdotes in this guide are illustrative composites-typical patterns with rounded numbers, not sourced case studies or measured results from a specific team.
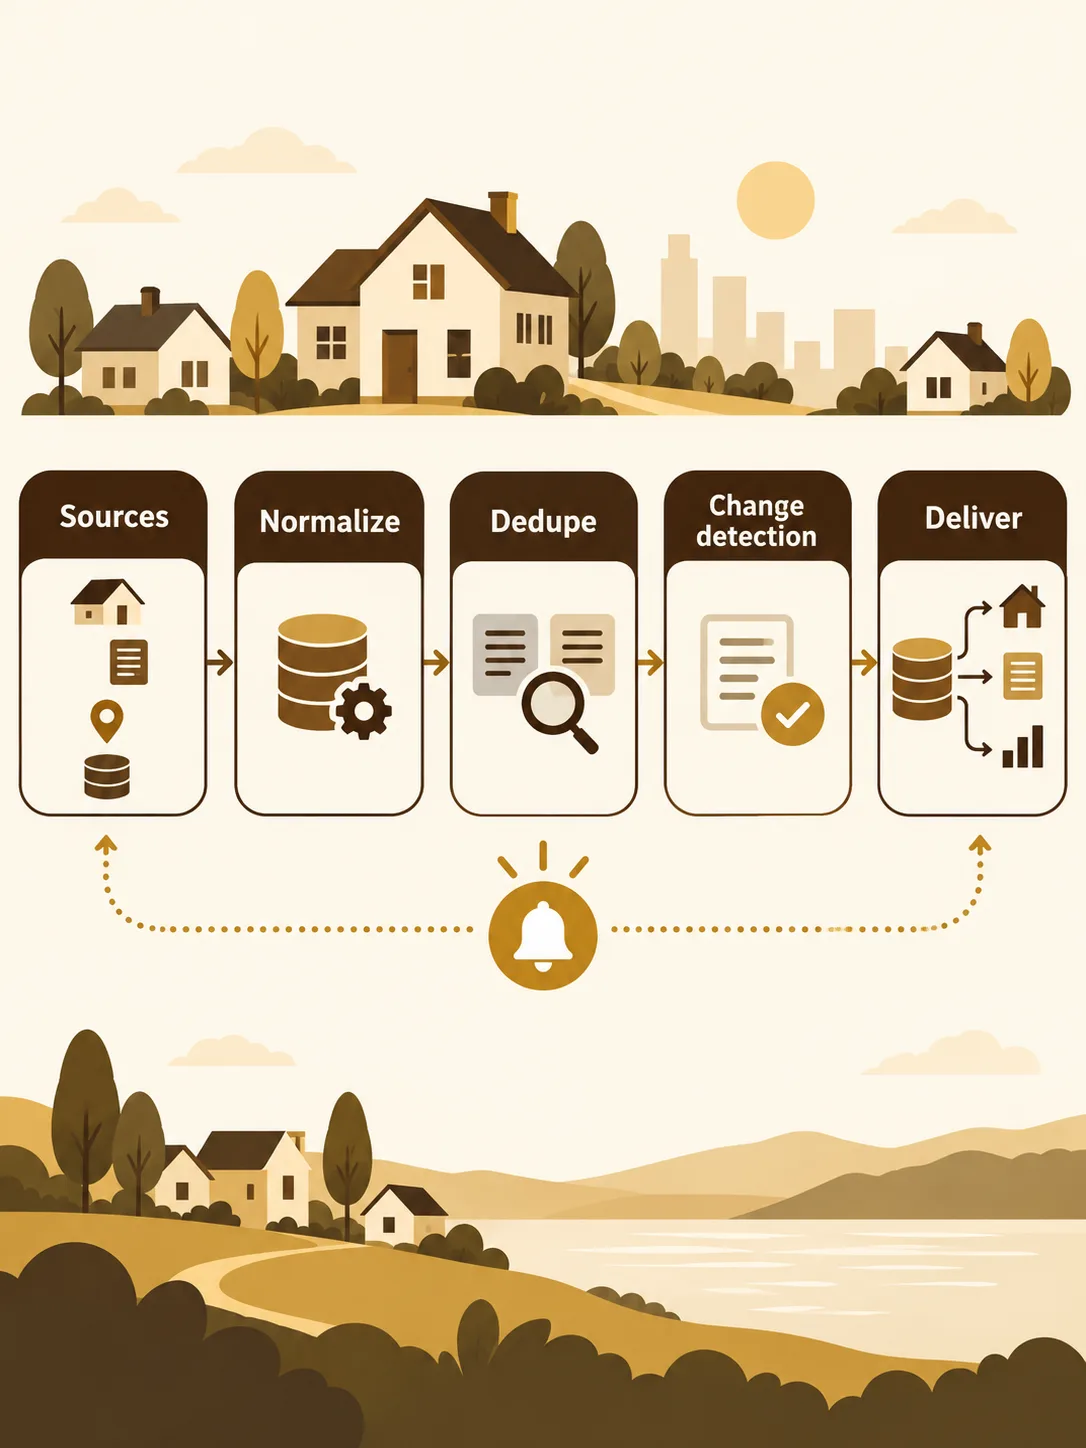
1) Start with a data contract
Before you write a single line of scraping code, define the schema you promise downstream systems-your CRM, dashboards, alert systems, mobile apps, and BI tools. This is your data contract, and it's the most important architectural decision you'll make. Without it, you'll spend months in a cycle of "we need one more field" and "can you change how this is formatted?"
Think of your data contract as an API specification. Just as you wouldn't build a REST API without defining endpoints and response schemas, you shouldn't build a data pipeline without defining your output schema. This contract isolates your extraction logic from your business logic. When an MLS changes their feed format (and they will), you update your extraction layer to continue honoring the contract-nothing downstream breaks.
A robust real estate data contract includes:
- Stable identifiers: A three-tier ID strategy is essential. The source listing ID (from MLS or website), a source identifier (which feed it came from), and an internal UUID that persists even if the property is re-listed or appears in multiple feeds. This prevents the nightmare scenario where your system treats a re-listing as a new property.
- Canonical address format + geocoding: Store addresses in a structured format: street number, street name, unit, city, state, ZIP+4, country. Always include latitude/longitude coordinates-never rely on address strings alone for location logic. Use a geocoding service to standardize addresses on ingestion, not at query time.
- Core property attributes: Price (always as numeric value in base currency units), bedrooms (as decimal to handle studio/0.5 bath scenarios), bathrooms (full + half separated), square footage (with type: total/living/heated), property type (normalized enum), and status (active/pending/sold/withdrawn/expired). Each field should have defined types and allowable ranges.
- Media and attachments: URLs to photos (with sequence order), virtual tour links, floor plan documents. Store references, not file data, in your primary schema. Always include a last-verified timestamp for media URLs since they expire.
- Attribution and provenance: Agent name, license number, brokerage, MLS number, and office contact info-but only where legally permitted. Some jurisdictions restrict display of agent data without consent. Track which fields came from which source.
- Temporal metadata: Three critical timestamps: first_seen (when you first ingested this listing), last_seen (most recent update), and last_changed (when substantive data changed, not just the scrape timestamp). These power your change detection and staleness monitoring.
Illustrative example: A national real estate tech company initially built scrapers that dumped raw HTML into S3, planning to "parse it later." Six months in, they had 40TB of HTML and no consistent schema. Every new feature required re-parsing the entire archive. After defining a contract and rebuilding their pipeline, new features went from 3-week projects to same-day deploys.
Common mistake: Making your contract too flexible. Developers often think "we'll just store JSON and let consumers figure it out." This pushes complexity downstream and guarantees inconsistency. Be opinionated. Define enums. Enforce types. Reject invalid data at the boundary.
Once the contract is clear, extraction can evolve independently. You can switch from scraping to API access, add new data sources, or improve parsing logic-all without changing downstream code. The contract is your stability layer.
2) Normalize early (or you'll pay later)
Every data source has its own dialect. One MLS calls it "Single Family Residence," another says "SFR," a third uses "Detached Home," and a scraper might extract "House." If you pass these through as-is, your users see duplicates in filters, your analytics are split across phantom categories, and your machine learning models treat identical properties as different types. Normalization is the process of translating all dialects into a single canonical representation.
The normalization principle: transform once, use everywhere. Do all normalization at ingestion time, not at query time. When you normalize during queries, you guarantee inconsistency-one developer uses different logic than another, caching becomes impossible, and performance suffers. Normalize at the boundary, store clean data, query clean data.
Critical normalization domains for real estate data:
- Addresses: Address normalization is harder than it looks. Start with consistent casing (Title Case for street names, UPPERCASE for state codes). Expand abbreviations consistently: "St" becomes "Street," "Apt" becomes "Apartment." Parse unit designations into separate fields-don't leave "123 Main St Apt 4B" as a string. Use USPS standards for US addresses. Normalize ZIP codes to ZIP+4 format when available (use a USPS API to append the +4 extension). Strip extra whitespace and special characters. For international properties, use country-specific formatting standards and always store the country code (ISO 3166-1 alpha-2).
- Property type enums: Create a master enum of property types and map all variations to it. Your canonical list might be: SINGLE_FAMILY, CONDO, TOWNHOUSE, MULTI_FAMILY, LAND, COMMERCIAL, MOBILE_HOME. Build a mapping table: "Single Family" → SINGLE_FAMILY, "SFR" → SINGLE_FAMILY, "House" → SINGLE_FAMILY, "Detached" → SINGLE_FAMILY. Store both the normalized value and the raw value for debugging. When you encounter unmapped values, log them for manual review-don't guess.
- Status normalization: Listing statuses are chaos across sources. Some use 10+ statuses, others use 3. Normalize to a small set: ACTIVE, PENDING, SOLD, WITHDRAWN, EXPIRED, OFF_MARKET. Map "Contingent," "Under Contract," "Pending Inspection" all to PENDING. Map "Closed," "Sold" to SOLD. Store the original status in a separate field for provenance.
- Numeric fields: Square footage is notoriously inconsistent. Some sources report total area, others only living space, others exclude garage and basement. Parse values like "2,450 sq ft" or "2450sqft" or "2.45k sq ft" into a clean numeric field. Validate ranges: reject square footage below 100 or above 50,000 for residential (adjust for your market). Store units explicitly: don't assume "sqft"-some countries use square meters. For prices, strip currency symbols and commas, store as integer cents (or smallest currency unit) to avoid floating-point issues. Validate against market ranges: a $50 house is probably a data error, not a bargain.
- Currency and financial fields: Always store currency as integers in the smallest unit (cents for USD). Never use floats for money-floating-point arithmetic introduces rounding errors that compound over time. Store the currency code (ISO 4217: USD, CAD, EUR) alongside the value. For display, format with proper locale rules in your application layer, not in the database. Handle HOA fees, property taxes, and other recurring costs consistently: store amount and period (monthly/annually) separately.
- Date and time normalization: Store all timestamps in UTC, convert to local time zones only for display. Parse dates in any format ("2024-03-15", "March 15, 2024", "3/15/24") into ISO 8601 format. Validate date ranges: a listing "first seen" in the future is invalid, a "sold date" before the "listed date" is wrong. Extract and store the list date, pending date, and sold date as separate fields-don't rely on status changes.
- Text field cleanup: Descriptions often contain copy-pasted artifacts: multiple spaces, weird line breaks, HTML fragments, phone numbers formatted 10 different ways. Strip HTML tags, normalize whitespace, remove non-printable characters. For phone numbers, use a library like libphonenumber to parse into E.164 format. Extract and normalize URLs-don't trust raw user input.
Illustrative scenario: A property search startup indexed listings from 6 MLS sources. They skipped normalization initially to "move fast." Six months later, searching for condos returned 40% of relevant results because "Condo," "Condominium," "Condo/Townhouse," and "Attached" were treated as different types. They spent 3 months re-indexing everything after building normalization logic. The lesson: normalization debt compounds faster than technical debt.
Implementation tip: Build a normalization library as a separate module with comprehensive unit tests. For each field type, write tests covering: valid inputs, edge cases (empty strings, nulls), malformed inputs, boundary values. Use property-based testing to generate random inputs. Normalization logic should be deterministic and well-tested because it runs on every record, and bugs here corrupt your entire dataset.
Common mistake: Normalizing too aggressively and losing information. Always store the original raw value alongside the normalized value. When your normalization logic improves, you can re-normalize from the original data without re-scraping. Create fields like property_type (normalized) and property_type_raw (original). This also helps debugging when normalization goes wrong.
3) Deduplicate by identity, not by hope
Nothing destroys user trust faster than duplicate listings. A buyer sees the same property listed three times at slightly different prices and assumes your data is garbage. An agent gets three notification emails for the same new listing and unsubscribes from all alerts. Duplicates make your platform look amateurish and unreliable, even if everything else works perfectly.
Deduplication is fundamentally a question of identity: how do you know two records represent the same real-world property? This is harder than it sounds because real estate has no universal identifier. MLS listing IDs change when properties are re-listed. Addresses alone aren't unique-multi-unit buildings have dozens of properties at the same address. Coordinates drift between data sources. You need a strategy that handles all these cases.
The three-tier identity strategy:
- Tier 1 - Source listing ID: When a data source provides a stable listing ID, use it as the primary identifier within that source. MLS systems typically assign unique listing numbers. Public listing sites use internal database IDs. These IDs are stable during the listing's lifecycle but often change if the property is withdrawn and re-listed. Store the source ID and source name together as a composite key: "zillow:12345" or "mls_regional:ABC123." This lets you track the same listing across updates from the same source.
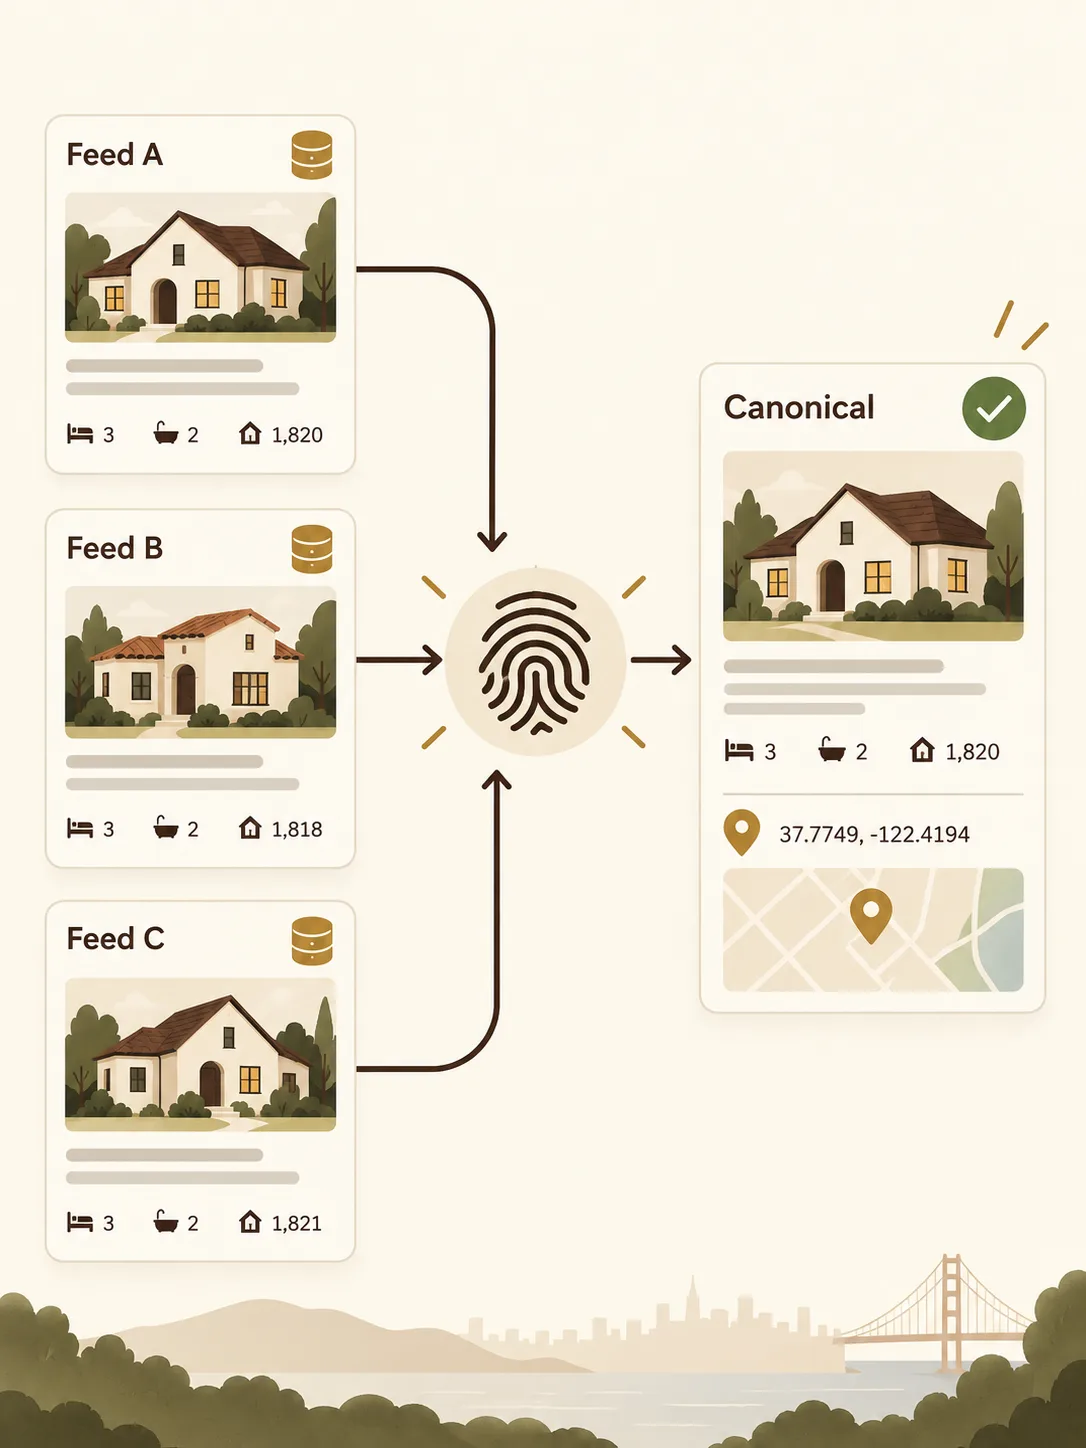
- Tier 2 - Address+unit+geo fingerprint: For cross-source matching, create a deterministic fingerprint from the normalized address, unit number, and rounded coordinates. Hash together: normalized street address + unit + city + state + ZIP5 + lat/lng rounded to 4 decimals. Example: hash("123 Main Street|Apt 4B|Boston|MA|02101|42.3601|-71.0589") = "abc123...". Use this fingerprint to match listings across sources. When two listings from different sources share the same fingerprint, they're probably the same property.
- Tier 3 - Internal UUID: Assign a permanent internal UUID to each unique property that persists across all sources and re-listings. This is your canonical property ID. When a listing is withdrawn from one MLS and re-listed in another, or appears simultaneously on Zillow and Redfin, the internal UUID stays the same. This UUID is what your API returns, what your database foreign keys reference, and what user favorites/alerts are tied to.
The merge problem: When you identify that two records represent the same property, you need a merge strategy. Don't just pick one record and discard the other-you'll lose data. Instead, create a unified view with source provenance for each field. Example: MLS might have more accurate square footage, but Zillow has better photos. Your merged record should use MLS sqft with a "source: mls_regional" tag and Zillow photo URLs with a "source: zillow" tag. Store this provenance so you can explain to users why you show certain values.
Handling conflicts: When sources disagree on a field value (one says $500k, another says $525k), you need a conflict resolution policy. Options: trust the primary source (usually MLS), take the most recent value, take the median, or flag for manual review. Document your policy explicitly. For critical fields like price and status, consider showing both values or flagging the conflict to users rather than hiding the discrepancy.
Illustrative example: A rental platform aggregated listings from 12 different sources. Initially, they deduplicated by exact address matching. This created havoc with multi-unit buildings: a 50-unit apartment building appeared as 50 separate properties, or worse, as one property with random unit data. After implementing the fingerprint approach with unit numbers, they reduced duplicates by 89% and improved user trust scores significantly.
Edge cases to handle:
- Stale re-listings: A property listed in January, withdrawn in February, and re-listed in March should be treated as the same property with a status transition-not as two separate properties. Use your address fingerprint to link the new listing to the old one, updating the internal UUID relationship.
- Multiple units in same building: Condos and apartments require unit-level granularity. "123 Main St Unit 5B" and "123 Main St Unit 6C" are different properties. Your fingerprint must include the unit identifier, normalized consistently.
- Sold properties that re-enter market: When a property sells and later gets listed again (new owner selling), this should create a new listing record but link to the same canonical property UUID. Your history should show: listed → sold → listed again.
- Coordinate drift: Different geocoding services return slightly different coordinates for the same address. Round coordinates to 4 decimal places (~11 meters precision) before fingerprinting to handle this drift.
- Typos in addresses: "123 Main Street" vs "123 Main St" should match after normalization. But "123 Main Street" vs "124 Main Street" should not-don't use fuzzy matching for addresses because false positives are worse than false negatives in deduplication.
Implementation tip: Build a deduplication audit dashboard. Show newly detected duplicates daily with side-by-side comparison. Track deduplication accuracy: what percentage of record pairs are correctly identified as same/different? Monitor false positive rate (incorrectly merged properties) and false negative rate (missed duplicates). Manual review of edge cases improves your fingerprint algorithm over time.
Common mistake: Deduplicating by deleting records. Never delete source records during deduplication. Instead, create a separate "canonical properties" table that links to all source records. This preserves provenance, allows you to improve deduplication logic without re-scraping, and enables debugging when deduplication goes wrong.
When a listing appears in multiple feeds, you should merge intentionally-never accidentally. Build explicit merge logic with provenance tracking, conflict resolution, and audit trails. Your users trust you to show them unique, accurate listings. Deduplication done right is invisible to users; done wrong, it's the first thing they complain about.
4) Use change detection instead of full refreshes
The naive approach to data pipelines is to scrape everything, overwrite your entire database, and call it a day. This works for demos but fails in production. Full refreshes are expensive (you're processing and storing the same data repeatedly), noisy (every downstream system gets notified of "changes" that aren't real changes), and wasteful (your database thrashes with unnecessary writes). Worse, you lose the ability to track what actually changed-was the price reduced or did you just re-scrape the same value?
Change detection is the difference between data and intelligence. Your users don't want a dump of 10,000 listings-they want to know which 50 listings had price drops today, which 12 just went pending, and which 3 new properties match their search criteria. Change detection enables alerts, notifications, trend analysis, and all the features that make your platform valuable instead of just another listing aggregator.
The hash-based change detection pattern:
- Compute content hashes: When you ingest a listing, compute a hash of the fields you care about tracking. Use a fast hashing algorithm like xxHash or MurmurHash. Include in the hash: price, status, bedrooms, bathrooms, square footage, description, photo count, and any other substantive fields. Exclude from the hash: timestamps, view counts, and any fields that change on every scrape but aren't meaningful updates. Store this hash alongside the listing record.
- Compare on update: When you re-scrape a listing, compute the new hash and compare it to the stored hash. If they match, skip the update-nothing meaningful changed. If they differ, you've detected a real change. Update the record, update the stored hash, and update the last_changed timestamp.
- Emit change events: When a hash changes, emit a structured event to an event stream (Kafka, SNS, webhook, etc.). The event should include: listing ID, timestamp, changed fields (computed by comparing old and new records), old values, new values. Downstream systems consume these events to trigger alerts, update caches, retrain models, etc.
- Track field-level deltas: Don't just track "something changed"-track exactly what changed. Compare the old and new record field-by-field. Store deltas in a history table: listing_id, timestamp, field_name, old_value, new_value. This enables powerful queries like "show me all listings that dropped price by 10%+ in the last week" or "properties that went from active to pending in under 7 days."
Designing meaningful change events: Not all changes are equally important. A price reduction of $50k is significant; a typo correction in the description is not. Implement smart event filtering:
- Price changes: Track absolute and percentage changes. Emit high-priority events for drops >5%, medium priority for 2-5%, low priority for <2%. Ignore trivial changes like $495,000 → $494,999 (likely listing fee adjustments).
- Status transitions: Active → Pending is a high-value signal (property getting traction). Pending → Active (deal fell through) is also valuable. Active → Withdrawn might indicate overpricing. Map out the status state machine and assign priority to each transition.
- Photo updates: New photos often signal a price drop is coming or that the property was staged. Track photo count changes and photo URL changes separately.
- Description edits: Full description rewrites might indicate repositioning. Minor edits are noise. Use text similarity (Levenshtein distance or embedding similarity) to classify as major vs minor edit.
- Days on market milestones: Compute days_on_market from list_date. Emit events at milestones: 30 days, 60 days, 90 days, 6 months. Long-sitting inventory is a strong negotiation signal for buyers.
Illustrative scenario: A buyer agent platform sent push notifications for "updates" to saved searches. Initially, they sent a notification every time they re-scraped a listing, even if nothing changed. Users got 50+ notifications per day, most for non-changes. After implementing hash-based change detection, they reduced notification volume by 94% while increasing engagement by 3x because every notification now represented a meaningful update.
Implementation pattern - the change log table: Create a dedicated table to store all changes: change_log (id, listing_id, timestamp, field_name, old_value, new_value, change_type, priority). This table becomes your source of truth for historical analysis. Query it to answer: "What price changes happened in zip code 02101 last month?" or "Which listings have had 3+ price reductions?" This data is gold for market analysis and agent tools.
Handling false positives: Sometimes data sources flip-flop values: price shows as $500k in one scrape, $550k in the next, back to $500k. This is source inconsistency, not real change. Implement deduplication logic: if a value changes and then reverts within a short window (e.g., 6 hours), suppress the change event or mark it as "unconfirmed." Only emit confirmed changes.
Incremental processing: Change detection enables efficient incremental processing. Instead of reprocessing your entire dataset every hour, you only process records that changed. This reduces compute costs dramatically. Example: recomputing property valuations (expensive ML inference) only when price or features change, not on every scrape.
Common mistake: Including timestamps in your content hash. If you hash(price, status, description, last_scraped_at), the hash changes on every scrape even when nothing meaningful changed. Only hash substantive fields. Store last_scraped_at separately to track freshness, but don't let it trigger change detection.
Testing change detection: Build synthetic test cases: create a listing, update the price, verify a change event fires. Update the description, verify the event includes the right diff. Re-scrape with no changes, verify no event fires. Test edge cases: null → value, value → null, value → same value. Change detection bugs are silent killers-listings appear stuck when they've actually updated.
This is what powers reliable alerts and clean reporting. Change detection transforms raw data into actionable intelligence. Users trust your platform when every alert matters, and you save compute resources by processing only what changed. It's a win-win that separates professional systems from amateur scrapers.
5) Operate safely (terms, rate limits, and resilience)
Before you scrape a single byte of data, understand the legal and ethical landscape. Data collection is governed by terms of service, copyright law, licensing agreements, and in some cases, specific real estate regulations. Ignoring these isn't just bad practice-it can result in legal action, IP bans, and reputational damage that destroys your business before it starts.
Legal and ethical foundations: Always respect licensing and terms of use for any data source. Many MLS systems offer data feeds through RETS or Web API with explicit licensing-use those when available. Public listing websites have terms of service that often prohibit scraping. If scraping is allowed, respect robots.txt and rate limits. For MLS data, understand your obligations under the agreement: can you store the data? Redistribute it? Display it publicly? Mix it with other sources? These details matter.
When you are legally allowed to collect data, build for resilience:
- Exponential backoff with jitter: When a request fails, don't retry immediately-the service is likely overloaded or you're being rate-limited. Use exponential backoff: wait 1 second, then 2, then 4, then 8, up to a maximum. Add random jitter (±20%) to avoid the thundering herd problem where all your workers retry simultaneously. Never implement infinite retry loops-set a maximum retry count (e.g., 5 attempts) and then mark the task as failed. Log the failure for investigation.
- Timeouts everywhere: Set aggressive timeouts on all external requests. Network timeout (connection establishment: 10 seconds), read timeout (receiving response: 30 seconds), total timeout (end-to-end: 60 seconds). Without timeouts, your workers hang indefinitely on slow endpoints, consuming resources and preventing new work. Better to fail fast and retry than to wait forever.
- Circuit breakers for flaky endpoints: Implement the circuit breaker pattern: if an endpoint fails repeatedly (e.g., 5 consecutive failures or 50% failure rate in 1 minute), "open the circuit" and stop sending requests for a cooldown period (e.g., 5 minutes). This prevents cascading failures where your pipeline hammers a down service, making it worse. After cooldown, allow one "test" request. If it succeeds, close the circuit and resume normal operation. If it fails, extend the cooldown.
- Rate limiting: Respect rate limits explicitly. If an API allows 100 requests/minute, implement token bucket or sliding window rate limiting to enforce 99 requests/minute (leave margin for safety). For scrapers, add delays between requests: 1-2 seconds for low-priority sources, 200-500ms for high-volume sources where allowed. Randomize delays slightly to avoid predictable traffic patterns. Store rate limit state in Redis or a similar shared store so multiple workers coordinate.
- Incremental runs with checkpoints: Design your pipeline to be resumable. When processing 10,000 listings, don't start from zero if the run fails at listing 7,500. Write checkpoints to durable storage (database, S3) every N records. If the pipeline crashes, resume from the last checkpoint. This is critical for large datasets-without checkpoints, transient failures force full re-runs, wasting hours of work.
- Schema validation at ingestion: Never trust input data. Validate every field against your schema before writing to the database. Use a validation library (Pydantic for Python, Joi for Node.js, etc.) to enforce types, ranges, and formats. Reject invalid records at the boundary-don't let bad data poison your database. Log rejected records with reasons for debugging. Example validations: price must be positive integer, bedrooms must be 0-20, status must be in allowed enum, ZIP must match regex pattern, lat/lng must be valid coordinates.
- Idempotency: Design operations to be idempotent-running the same operation twice produces the same result. Use upsert logic: insert if new, update if exists. Assign deterministic IDs based on content, not random UUIDs. This way, if a pipeline run partially completes and restarts, it doesn't create duplicates. Idempotency is your safety net when distributed systems inevitably fail and retry.
- Graceful degradation: When one data source is down, the entire pipeline shouldn't stop. Isolate failures: if MLS feed is unavailable, continue processing Zillow and Redfin. Mark affected listings as "stale" but keep serving them. Alert on-call engineers about the outage but don't break the user experience. Build dashboards showing source health so you know what's working.
- Request/response logging: Log all outbound requests and responses (or at least failures) for debugging. Include: timestamp, endpoint, request parameters, response status, response time, error message. When a data source changes its schema or starts returning errors, these logs are your first clue. Use structured logging (JSON) so logs are machine-readable for analysis.
Illustrative example: A real estate startup scraped a popular listing site without rate limiting. They made 10,000 requests in 2 minutes. The site's abuse detection flagged them, IP-banned their entire AWS subnet, and sent a cease-and-desist letter. The startup had to migrate to a new hosting provider, implement proper rate limiting, and negotiate with the site's legal team to get unbanned. The incident cost them 2 weeks of development time and $15k in legal fees. Lesson: respect rate limits from day one.
Handling HTML/schema changes: Public listing sites change their HTML structure constantly-weekly for some sites. Your scraper will break. Build defenses: use multiple selector strategies (CSS, XPath, regex fallback), validate extracted data, alert when extraction confidence drops, keep the last N versions of page HTML for debugging, use screenshot diffs to detect layout changes. Consider using AI-based extraction (like GPT-4 Vision) as a fallback when selectors fail.
Common mistake: Building brittle scrapers with hardcoded selectors and no error handling. When the site changes, the scraper silently fails-extracting null values or wrong values without alerting anyone. Weeks later, you discover your database has been filling with garbage. Build validation into every extraction: if you expect a price and get null, that's a failure-alert immediately, don't write the record.
Testing resilience: Build chaos tests: simulate network failures, slow responses, malformed HTML, rate limit errors. Does your pipeline recover gracefully? Use tools like Toxiproxy to inject failures into your test environment. Test scenarios: database connection drops mid-run (does it checkpoint?), API returns 500 errors (does it retry with backoff?), HTML structure changes (does it alert?), rate limit hit (does it back off?). Resilience isn't a feature you add later-it's a design principle from day one.
6) Monitoring is not optional
A data pipeline without monitoring is a black box. You have no idea if it's working correctly until users complain about stale data, missing listings, or duplicate records. By then, trust is already damaged. Monitoring is your early warning system-it tells you when something breaks before your users notice, and it gives you the data to fix problems quickly instead of guessing.
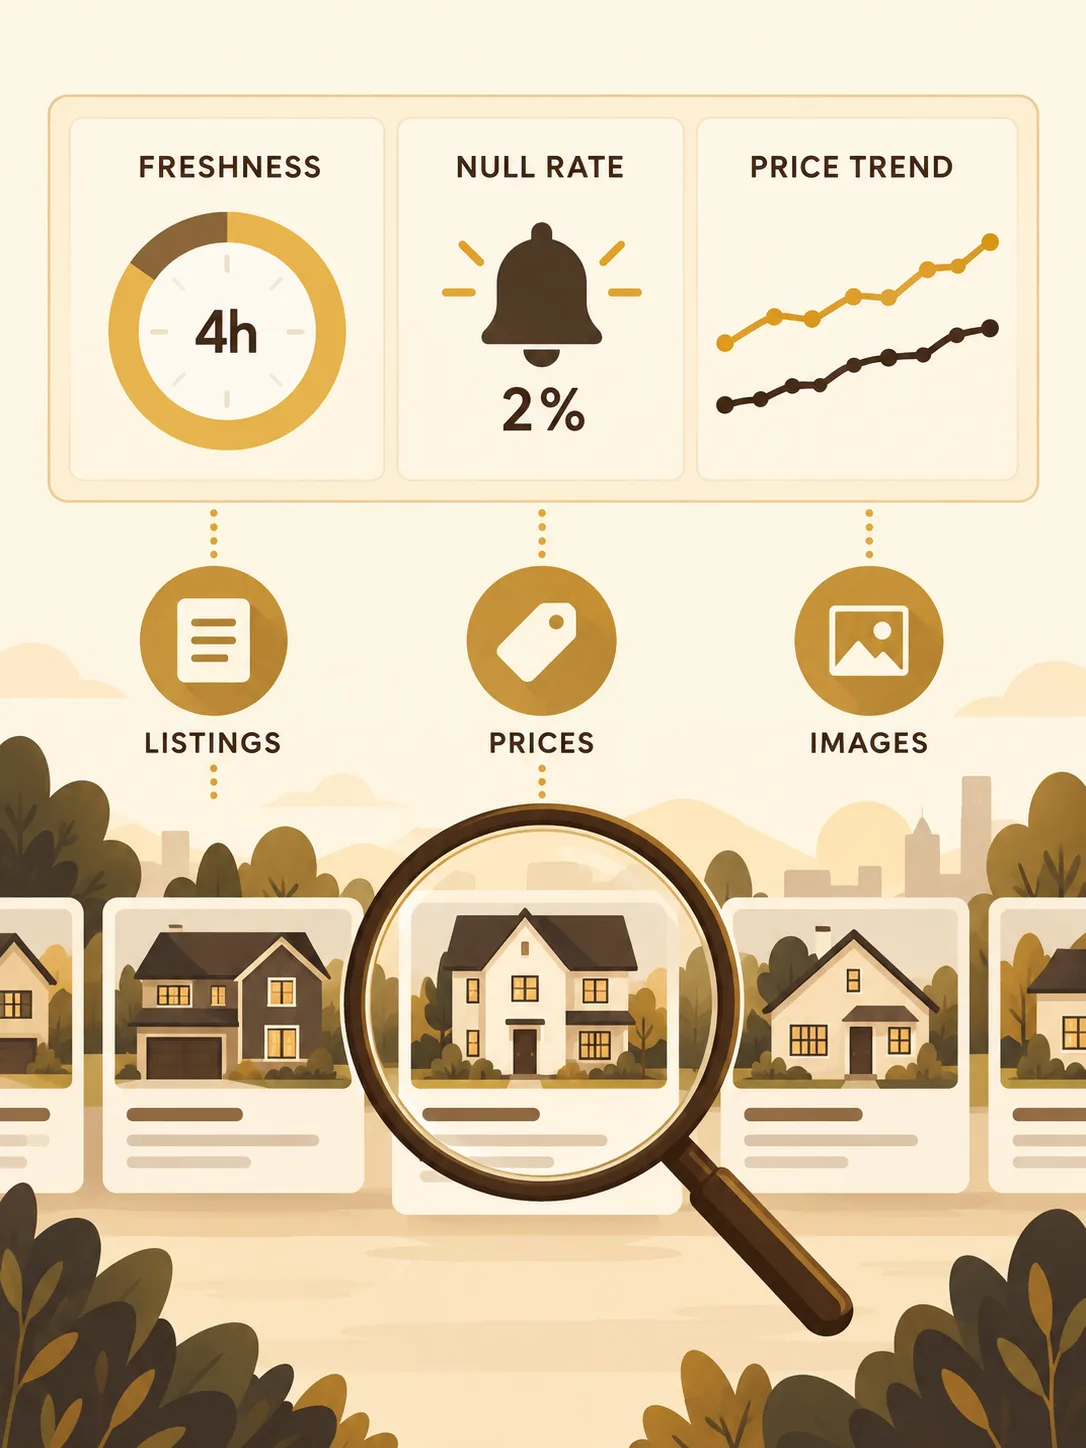
Monitoring is not just "is it running"-it's "is it working correctly." A pipeline can run without errors but produce garbage data. It can succeed on 90% of listings but silently fail on the other 10%. It can run twice as long as normal, indicating a problem with the data source. Comprehensive monitoring tracks both operational health (is the pipeline functioning?) and data quality (is the data correct?).
Two dashboards make or break your sanity:
Dashboard 1: Pipeline Health Metrics
- Run duration by source: Track how long each pipeline run takes. Plot as a time series. If a run that normally takes 15 minutes suddenly takes 2 hours, something changed-the data source added rate limiting, network latency increased, or the dataset grew unexpectedly. Set alerts: if duration > 2x the 7-day average, investigate.
- Success rate: What percentage of listings were successfully processed vs failed? Track overall rate and per-source rate. A 95% success rate sounds good until you realize you're losing 500 listings per day. Set a threshold: alert if success rate drops below 98%.
- Error types and frequencies: Categorize errors: network errors, parsing errors, validation errors, database errors. Track count of each type over time. A spike in parsing errors means the data source changed their schema. A spike in network errors means connectivity issues. Group by error message and count occurrences-don't alert on every individual error, alert when error rate exceeds threshold.
- Retry attempts: How often is the pipeline retrying requests? High retry counts indicate flaky endpoints or rate limiting issues. Track retry counts per source. If retries > 10% of total requests, investigate the source health.
- Records processed: Total listings ingested per run. Plot as time series. A sudden drop (e.g., from 10,000 to 3,000 listings) indicates the data source is down, filtered results incorrectly, or changed their pagination. Alert when records processed < 80% of 7-day average.
- Throughput: Records processed per minute. Helps identify bottlenecks. If throughput drops significantly, check for database performance issues, network saturation, or CPU constraints.
- Pipeline lag: How far behind real-time is your data? For sources with timestamps, compare the most recent listing timestamp to current time. If lag exceeds 6 hours, your pipeline is falling behind-scale up or optimize.
Dashboard 2: Data Quality Metrics
- Duplicate rate: Percentage of listings flagged as duplicates. Track over time. An increase in duplicates might indicate your deduplication logic broke, or a source started sending duplicate records. Aim for <1% duplicate rate.
- Missing critical fields: Count listings with null values in critical fields: price, address, status, bedrooms. Track as percentage of total records. If 20% of listings are missing prices, your extraction is broken. Set thresholds: alert if null rate for critical fields > 2%.
- Outliers and anomalies: Detect statistically improbable values. Examples: price > $50M (unless you're dealing with luxury estates), square footage < 100 sqft, bedrooms > 20. Flag these for review. Track outlier count-a spike indicates parsing bugs (e.g., capturing square meters as square feet).
- Stale records: Count listings where last_scraped_at is more than N hours old. Stale records indicate the source stopped updating or your scraper stopped reaching certain listings. Alert if stale count exceeds threshold.
- Status distribution: Track the distribution of listing statuses (active/pending/sold). If 90% of listings suddenly show as "sold," your status extraction is broken or the source changed their data model. Monitor for unexpected shifts in distribution.
- Price distribution by property type: Track median price for each property type over time. A sudden drop in median condo price might indicate data quality issues (extracting HOA fees instead of sale price) or a real market shift. Visualize as time series to spot anomalies.
- Photo count statistics: Track average photos per listing. A drop from 15 to 3 photos indicates your media extraction broke. Monitor as time series.
- New vs existing listings ratio: What percentage of records in each run are new listings vs updates to existing? A ratio shift indicates changes in source behavior or scraper coverage.
Alerting strategies: Metrics without alerts are just data points. Configure alerts for anomalies:
- Sudden drop in new listings: If new_listings_today < 50% of new_listings_7day_avg, alert immediately. This indicates your pipeline stopped discovering new listings or the source is down.
- Spike in parse errors: If parse_error_rate > 5%, alert. The data source likely changed their HTML structure or API schema.
- Zero changes detected: If your change detection reports zero changes for 6+ hours, something is wrong. Either the source stopped updating (unlikely) or your change detection broke (likely). Alert and investigate.
- Database lag: If the time between pipeline start and completion exceeds threshold, alert. Your database might be overloaded or your queries are slow.
- Source unavailable: If a data source returns errors for 3+ consecutive runs, alert with high priority. The source might be permanently down or blocking you.
Illustrative scenario: A real estate data company ran pipelines but didn't monitor data quality. For 3 weeks, their parser extracted "beds: null" for all listings due to a schema change. They only discovered the issue when a major customer complained that search filters weren't working. After implementing data quality monitoring with alerts on null rates, they caught similar issues within minutes instead of weeks.
Implementation tips: Use a dedicated observability platform (Datadog, Grafana, Prometheus, CloudWatch) rather than building custom dashboards. These tools provide out-of-the-box alerting, anomaly detection, and visualization. Emit metrics from your pipeline code using a metrics library (StatsD, Prometheus client). Structure logs in JSON so they're queryable. Use distributed tracing (OpenTelemetry) to debug performance issues across services.
Sample metrics emission (pseudo-code):
- Start of run: emit("pipeline.run.started", {source: "mls_regional"})
- Successful listing: emit("pipeline.listing.processed", {source, status: "success"})
- Failed listing: emit("pipeline.listing.processed", {source, status: "failed", error_type: "parse_error"})
- Duplicate detected: emit("pipeline.duplicate.detected", {source, fingerprint})
- Change detected: emit("pipeline.change.detected", {listing_id, field: "price", old_value, new_value})
- End of run: emit("pipeline.run.completed", {source, duration_seconds, records_processed, success_count, error_count})
Common mistake: Monitoring only errors and ignoring successful runs. Silent failures are more dangerous than loud ones. A pipeline that runs successfully but extracts wrong data (e.g., extracting HOA fees as price) won't trigger error alerts. Monitor data distribution, value ranges, and null rates to catch silent failures.
Add alerts for anomalies: sudden drop in new listings, spike in parse errors, or zero changes detected. Build dashboards that give you confidence your pipeline is healthy, and alerts that wake you up when it's not. Monitoring transforms "hope it's working" into "know it's working." That confidence is what separates professionals from amateurs.
7) Deliver the data in a usable shape
A data pipeline's value isn't in the data it collects-it's in how that data gets used. Your downstream users don't want "raw HTML" dumped in S3 or JSON blobs with inconsistent schemas. They want searchable, reliable, well-documented data delivered through interfaces that match their workflows. The delivery layer is what transforms your pipeline from infrastructure into product.
Think from the user's perspective: An agent wants to search for "3-bedroom condos under $600k in downtown Boston that were listed in the last 7 days with price drops." A buyer wants push notifications when properties matching their criteria hit the market or drop price. An analyst wants to export 6 months of price history to Excel for market trend analysis. A CRM system wants to automatically create leads from new high-value listings. Your delivery layer needs to support all these use cases with minimal custom work.
What downstream users actually want:
- Searchable inventory (API or database): Provide a REST or GraphQL API with rich filtering, sorting, and pagination. Essential filters: location (city, ZIP, radius search by coordinates), price range, property type, bedrooms/bathrooms, square footage, status, listing date. Support complex queries: "condos OR townhouses" and "price < $500k" and "bedrooms >= 2" and "listed_within last 7 days." Return consistent JSON with well-documented schemas. Use OpenAPI/Swagger for auto-generated API docs. For high-volume consumers, provide database read replicas with clear schema documentation.
- Change events for alerts and workflows: Expose a webhook system or event stream (Kafka, Pub/Sub, SNS) for real-time updates. Users subscribe to event types: "new_listing," "price_drop," "status_change," "sold." Events should be structured, versioned, and include enough context that consumers don't need to make additional API calls. Example: {"event": "price_drop", "listing_id": "abc123", "old_price": 550000, "new_price": 525000, "drop_percent": 4.5, "listing_url": "...", "address": {...}}. Support event filtering: "only notify me of price drops >5% in zip 02101."
- Exports to BI tools: Provide batch export endpoints: CSV, Parquet, JSON Lines. Support date-range queries: "export all listings that changed between 2024-01-01 and 2024-01-31." For larger datasets, use signed URLs to S3/GCS rather than streaming through your API. Integrate with popular BI platforms: provide Tableau/Looker connectors, or at minimum, document how to connect your database as a data source. For analytics teams, provide a denormalized reporting table with pre-joined data and pre-computed metrics.
- Clean integration hooks for CRM and lead routing: Provide Zapier/Make integrations for no-code automation. Offer SDKs in popular languages (Python, JavaScript, PHP) with usage examples. Support OAuth2 for secure third-party integrations. For CRM systems, provide webhook templates: "when a listing matching criteria X goes active, POST to CRM endpoint Y with fields mapped Z." Consider building direct integrations with major real estate CRMs (Salesforce, HubSpot, Follow Up Boss).
- Historical data and time-travel queries: Users want to know "what was this listing's price 30 days ago?" or "show me the price history for this property." Maintain a history table or use event sourcing so you can reconstruct state at any point in time. Provide API endpoints: GET /listings/{id}/history?field=price for price timeline, GET /listings/{id}?as_of=2024-01-15 for point-in-time snapshot.
- Bulk operations and data dumps: For partners who want full data access, provide bulk download endpoints. Document rate limits and best practices. Offer incremental exports: "give me all listings that changed since my last sync at timestamp T." Use cursor-based pagination for large result sets-offset/limit pagination breaks at scale.
- Data quality metadata: Expose confidence scores or data completeness indicators. Example: listing has price (confidence: high), square footage (confidence: medium, source doesn't always provide), school district (confidence: low, inferred from coordinates). This transparency helps users decide which fields to rely on for critical decisions.
Illustrative example: A PropTech startup built an amazing scraper but delivered data as daily JSON dumps in S3. Every downstream team had to build custom ETL to load the data, handle schema changes, and deduplicate. It took 3 months to onboard each new customer. After building a proper API with webhooks and SDKs, onboarding time dropped to 3 days, and customer satisfaction scores doubled.
API design best practices:
- Versioning: Use URL versioning (/v1/listings, /v2/listings) or header-based versioning. Never break existing API contracts-deprecate with long notice periods (6+ months) and provide migration guides.
- Rate limiting: Implement fair rate limits (e.g., 1000 requests/hour for free tier, 10,000 for paid). Return rate limit headers: X-RateLimit-Limit, X-RateLimit-Remaining, X-RateLimit-Reset. Document rate limits clearly.
- Error handling: Return structured error responses with HTTP status codes, error codes, and human-readable messages. Example: {"error": {"code": "INVALID_ZIP", "message": "ZIP code must be 5 digits", "field": "zip"}}. Log errors server-side for debugging.
- Caching: Use ETags and Last-Modified headers for efficient caching. Support conditional requests (If-None-Match, If-Modified-Since) to minimize bandwidth. Cache heavily-accessed listings (popular properties) in CDN or Redis.
- Documentation: Provide interactive API docs (Swagger UI). Include example requests/responses in multiple languages. Write guides for common use cases: "How to find price drops," "How to set up listing alerts," "How to export data to Excel."
Database delivery considerations: If you provide direct database access, design your schema for consumer convenience, not just storage efficiency. Create views that hide complexity: a "listings_active" view that filters to active listings and joins in agent/property data. Provide read-only credentials. Document schema changes in a changelog. Use semantic versioning for schema: major version for breaking changes, minor for additions.
Common mistake: Building the delivery layer as an afterthought. Teams spend 90% of effort on extraction/processing and 10% on delivery, then wonder why adoption is low. The delivery layer is your product interface-invest in it. A mediocre scraper with a great API beats a great scraper with no API.
Testing delivery: Build integration tests from the consumer's perspective. Can a user actually search for "condos under $500k"? Do webhooks fire reliably? Is the API response time acceptable (target: <200ms for p95)? Test with realistic query patterns and data volumes. Use tools like Postman/Insomnia to document and test API workflows.
The delivery layer transforms your raw data into actionable intelligence that drives decisions, powers workflows, and integrates seamlessly into existing systems. It's the difference between having data and having a data product. Invest in great delivery, and your users will love you for it.
Treat data reliability like product quality. That's how you keep teams using it-and trusting it.
Need a data pipeline you can trust?
We build ingestion + monitoring systems designed for real operations-not demos.
Get in TouchA los equipos les encanta el dato... hasta que deja de ser confiable. Si tu "pipeline" es un scraper corriendo en la laptop de alguien, un cambio de HTML puede romper dashboards, dejar listados obsoletos y perder oportunidades. En el momento en que tus datos de precios estan desfasados 24 horas, o los duplicados inundan tus resultados de busqueda, la confianza se evapora. Los agentes dejan de revisar tu plataforma. Los compradores pierden oportunidades. Tu ventaja competitiva desaparece.
El panorama de datos inmobiliarios es unicamente desafiante. Los feeds MLS se actualizan de forma irregular, los sitios de listados publicos cambian su markup semanalmente, y diferentes fuentes usan esquemas completamente incompatibles para la misma propiedad. Un departamento puede ser "Unit 5B" en un feed, "5-B" en otro, y "Apt 5B" en un tercero. Los precios pueden incluir expensas en una fuente pero excluirlas en otra. Algunos feeds proporcionan metros cuadrados como area total, otros solo como espacio habitable.
Construir un pipeline de datos inmobiliarios confiable no se trata de escribir codigo inteligente de scraping-se trata de establecer sistemas que manejen varianza, detecten fallas y mantengan calidad de datos bajo cambio constante. La diferencia entre un script fragil y un pipeline de produccion es la misma que entre un prototipo y un producto: uno funciona hasta que deja de funcionar, el otro esta diseñado para fallar con gracia y recuperarse automaticamente.
Un pipeline de produccion no es solo extraccion: es contratos, normalizacion, deduplicacion, deteccion de cambios y monitoreo. Cada uno de estos componentes es no negociable para confiabilidad a escala.
Como leer las historias: las anecdotas de empresas en esta guia son composiciones ilustrativas-patrones tipicos con numeros redondeados, no casos de estudio con fuente ni resultados medidos de un equipo especifico.
1) Empieza con un contrato de datos
Antes de escribir una sola linea de codigo de scraping, define el esquema que prometes a los sistemas downstream-tu CRM, dashboards, sistemas de alertas, apps moviles y herramientas de BI. Este es tu contrato de datos, y es la decision arquitectonica mas importante que tomaras. Sin el, pasaras meses en un ciclo de "necesitamos un campo mas" y "puedes cambiar como se formatea esto?"
Piensa en tu contrato de datos como una especificacion de API. Asi como no construirias una API REST sin definir endpoints y esquemas de respuesta, no deberias construir un pipeline de datos sin definir tu esquema de salida. Este contrato aisla tu logica de extraccion de tu logica de negocio. Cuando un MLS cambia el formato de su feed (y lo haran), actualizas tu capa de extraccion para continuar honrando el contrato-nada downstream se rompe.
Un contrato robusto de datos inmobiliarios incluye:
- Identificadores estables: Una estrategia de ID de tres niveles es esencial. El ID de listado de la fuente (del MLS o sitio web), un identificador de fuente (de que feed vino), y un UUID interno que persiste incluso si la propiedad se re-lista o aparece en multiples feeds. Esto previene el escenario de pesadilla donde tu sistema trata un re-listado como una nueva propiedad.
- Formato de direccion canonico + geocodificacion: Almacena direcciones en formato estructurado: numero de calle, nombre de calle, unidad, ciudad, estado, codigo postal, pais. Siempre incluye coordenadas latitud/longitud-nunca confies solo en strings de direccion para logica de ubicacion. Usa un servicio de geocodificacion para estandarizar direcciones en la ingesta, no en tiempo de consulta.
- Atributos core de propiedad: Precio (siempre como valor numerico en unidades de moneda base), dormitorios (como decimal para manejar escenarios de estudio/0.5 baño), baños (completos + medios separados), metros cuadrados (con tipo: total/habitable/calefaccionado), tipo de propiedad (enum normalizado), y estado (activo/pendiente/vendido/retirado/expirado). Cada campo debe tener tipos definidos y rangos permitidos.
- Media y adjuntos: URLs de fotos (con orden de secuencia), enlaces de tours virtuales, documentos de planos. Almacena referencias, no datos de archivos, en tu esquema primario. Siempre incluye un timestamp de ultima verificacion para URLs de media ya que expiran.
- Atribucion y procedencia: Nombre de agente, numero de licencia, inmobiliaria, numero MLS, e info de contacto de oficina-pero solo donde este legalmente permitido. Algunas jurisdicciones restringen la visualizacion de datos de agente sin consentimiento. Rastrea que campos vinieron de que fuente.
- Metadata temporal: Tres timestamps criticos: first_seen (cuando ingestaste el listado por primera vez), last_seen (actualizacion mas reciente), y last_changed (cuando cambio data sustantiva, no solo el timestamp de scrape). Estos alimentan tu deteccion de cambios y monitoreo de obsolescencia.
Ejemplo ilustrativo: Una empresa tech inmobiliaria nacional inicialmente construyo scrapers que volcaban HTML crudo en S3, planeando "parsearlo despues." Seis meses despues, tenian 40TB de HTML y ningun esquema consistente. Cada nueva funcionalidad requeria re-parsear el archivo completo. Despues de definir un contrato y reconstruir su pipeline, nuevas funcionalidades pasaron de proyectos de 3 semanas a deploys del mismo dia.
Error comun: Hacer tu contrato demasiado flexible. Los desarrolladores a menudo piensan "solo almacenaremos JSON y dejaremos que los consumidores lo descifren." Esto empuja complejidad downstream y garantiza inconsistencia. Se opinado. Define enums. Fuerza tipos. Rechaza datos invalidos en el limite.
Con el contrato claro, la extraccion puede evolucionar independientemente. Puedes cambiar de scraping a acceso API, agregar nuevas fuentes de datos, o mejorar la logica de parseo-todo sin cambiar codigo downstream. El contrato es tu capa de estabilidad.
2) Normaliza temprano (o lo pagaras despues)
Fuentes distintas describen lo mismo de formas distintas. Normaliza a un modelo canonico:
- Direcciones: formato consistente, parsing de unidad, ZIP normalizado
- Enums: mapear "Single Family", "SFR", "House" a un valor
- Numeros: parsear y validar sqft/fees/impuestos; eliminar valores imposibles
- Moneda: guardar numero; formatear al final
3) Deduplica por identidad, no por esperanza
Los duplicados destruyen confianza. Necesitas una estrategia de identidad:
- Preferir el listing ID de la fuente cuando sea estable
- Para matching entre fuentes: fingerprint por address+unit+geo
- Guardar procedencia: que fuente aporto cada campo
Si un listing aparece en varios feeds, lo fusionas intencionalmente-nunca por accidente.
4) Usa deteccion de cambios en lugar de "refresh total"
Scrapear todo cada hora es caro y ruidoso. En su lugar:
- Guardar un hash de campos importantes (precio/status/media)
- Emitir eventos "changed" solo cuando cambie el hash
- Registrar deltas: bajadas de precio, cambios de status, ediciones
Asi se construyen alertas confiables y reporting limpio.
5) Opera de forma segura (terminos, limites y resiliencia)
Respeta siempre licencias y terminos de uso. Cuando este permitido recopilar datos, construye para resiliencia:
- Backoff + retries con jitter (no loops infinitos)
- Timeouts y circuit breakers
- Ejecuciones incrementales con checkpoints
- Validacion de schema para no "envenenar" la base
6) El monitoreo no es opcional
Dos dashboards te salvan:
- Salud del pipeline: duracion, success rate, tipos de error, retries
- Calidad de datos: duplicados, faltantes, outliers, registros stale
Configura alertas: caida repentina de nuevos listados, pico de errores de parseo, o cero cambios detectados.
7) Entrega datos "usables"
Tu usuario final no quiere "HTML crudo". Quiere:
- Inventario searchable (API o base)
- Eventos de cambio para alertas y workflows
- Exports a BI
- Hooks para CRM y routing
Trata la confiabilidad del dato como calidad de producto. Asi mantienes a los equipos usando tu pipeline-y confiando en el.
Necesitas un pipeline confiable?
Construimos sistemas de ingestion + monitoreo disenados para operaciones reales-no demos.
ContactanosTimes de real estate amam dados... ate que eles fiquem pouco confiaveis. Se seu "pipeline" e um scraper rodando no notebook de alguem, uma mudanca no HTML pode quebrar dashboards, deixar anuncios desatualizados e custar oportunidades.
Um pipeline de producao nao e so extracao: e contratos, normalizacao, deduplicacao, deteccao de mudancas e monitoramento.
Como ler as historias: os casos de empresas neste guia sao composicoes ilustrativas-padroes tipicos com numeros arredondados, nao estudos de caso com fonte nem resultados medidos de uma equipe especifica.
1) Comece com um contrato de dados
Defina o schema prometido para sistemas downstream (CRM, dashboards, alertas). Um contrato simples evita retrabalho:
- IDs estaveis (listing IDs, source IDs, IDs internos)
- Endereco canonico + geo (lat/lng)
- Preco, quartos, banheiros, area, tipo, status
- Midia (fotos), dados de corretor/broker quando permitido
- Timestamps: first seen, last seen, last changed
Com o contrato claro, a extracao evolui sem quebrar o resto.
2) Normalize cedo (ou voce paga depois)
Fontes diferentes descrevem a mesma coisa de formas diferentes. Normalize para um modelo canonico:
- Enderecos: formatacao consistente, parsing de unidade, CEP normalizado
- Enums: mapear "Single Family", "SFR", "House" para um valor
- Numeros: parsear e validar area/taxas; descartar valores impossiveis
- Moeda: salvar numero; formatar no final
3) Deduplicate por identidade, nao por esperanca
Duplicatas destroem confianca. Voce precisa de uma estrategia de identidade:
- Preferir o listing ID da fonte quando for estavel
- Para matching entre fontes: fingerprint por endereco+unidade+geo
- Guardar procedencia: qual fonte forneceu cada campo
Quando o anuncio aparece em multiplos feeds, voce faz merge de forma intencional.
4) Use deteccao de mudancas (nao refresh total)
Scrapear tudo a cada hora e caro e barulhento. Em vez disso:
- Armazene um hash de campos importantes (preco/status/midia)
- Emita eventos "changed" so quando o hash mudar
- Registre deltas: queda de preco, troca de status, edicoes
Isso alimenta alertas confiaveis e relatorios limpos.
5) Opere com seguranca (termos, limites e resiliencia)
Respeite sempre licencas e termos de uso. Quando for permitido coletar dados, construa para resiliencia:
- Backoff + retries com jitter (nao loops infinitos)
- Timeouts e circuit breakers
- Execucoes incrementais com checkpoints
- Validacao de schema para nao contaminar o banco
6) Monitoramento nao e opcional
Dois dashboards salvam sua operacao:
- Saude do pipeline: duracao, success rate, tipos de erro, retries
- Qualidade: duplicatas, campos faltando, outliers, registros stale
Crie alertas: queda brusca em novos anuncios, pico de erros de parsing, ou zero mudancas detectadas.
7) Entregue dados utilizaveis
O usuario final nao quer "HTML cru". Ele quer:
- Inventario pesquisavel (API ou banco)
- Eventos de mudanca para alertas e workflows
- Exports para BI
- Integracoes com CRM e roteamento
Trate confiabilidade de dados como qualidade de produto. E assim que voce mantem times usando seu pipeline-e confiando nele.
Precisa de um pipeline confiavel?
Construimos sistemas de ingestao + monitoramento para operacoes reais-nao demos.
Fale com a gente